

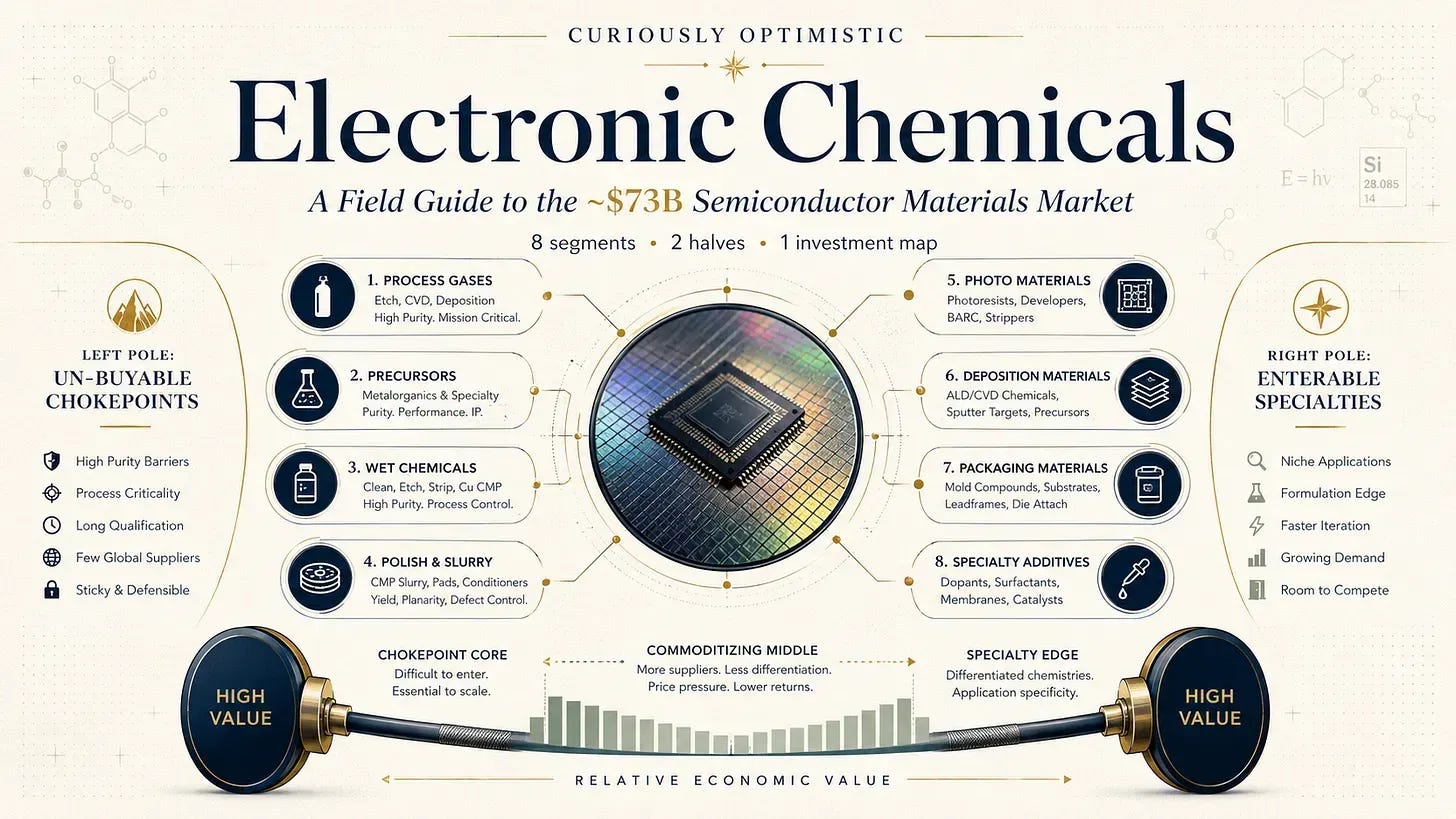
Electronic chemicals are the consumables a chip factory buys by the barrel: the specialty chemicals, gases, and materials it uses to coat, print, etch, clean, polish, and connect a silicon wafer at almost every one of the hundreds of layers in a modern chip. They are a small slice of what a chip costs. But if any one of them is even slightly impure, the whole wafer, worth thousands of dollars, is scrapped. That asymmetry, tiny cost and total consequence, is why parts of this market earn software-like margins on commodity-sounding chemistry.
This guide cuts the market a particular way. The trade tables slice it by chemistry class: acids, gases, resist, slurry. It cuts it instead by economic behavior, because that is what an investor is actually buying: how deeply a material is qualified into a fab, who captures the value, how concentrated the supply is, and whether a financial buyer can enter at all.
The one-picture thesis: a barbell
Value concentrates at two poles and drains from the middle.
At one pole sit the chokepoints: mask blanks, the EUV pellicle, the ABF film in advanced packaging. These are the richest positions and effectively un-buyable; the parent companies own them. At the other pole sit the specialties (deposition precursors, the packaging materials matrix), which are rich and, crucially, enterable. In between is the commoditizing middle, led by wet chemicals, where value is competed away and where China localizes first.
For a financial buyer, the entire game is to reach the right-hand pole (high moat and open to entry) and to avoid the middle.
The market: about $73B, across eight segments
The semiconductor-materials market runs about $73B in 2025: roughly $45.8B making the chip on the wafer (front-end) and $27.4B cutting it out, stacking, and packaging it (back-end, and growing faster on AI packaging demand). Sizes are directional and scopes differ by source, but the eight investable segments fall out cleanly.
The dashboard: eight segments, scored the way an investor reads them
Every segment on one screen: size, growth, structure, margin, moat, and how open it is to a financial buyer.
Photoresist: ~$5B, ~5% growth (EUV ~24%). Japan oligopoly. Margin high (~23%+). Moat: qualification lock-in. PE entry: low.
Advanced packaging: ~$27B pool, ~9%+ (HBM ~21%). Barbell: an ABF monopoly plus a fragmented matrix. Margin mixed (7–50%). PE entry: high.
Deposition precursors: ~$1.7B, ~10%. Platforms plus a specialist tail. Margin high (>30%). Moat: sole-source molecule. PE entry: high.
Electronic gases: ~$6.3B, ~5%. Bulk oligopoly plus specialty chokepoints. Margin high (~30–40%). Moat: on-site annuity. PE entry: medium.
Wet chemicals: ~$5.5B, ~5%. Fragmented, with one HF chokepoint. Margin thin (~9%). PE entry: medium.
Sputtering targets: ~$1.8B, ~7%. JX-led oligopoly, now public. Margin mid (~20–25%). PE entry: low.
CMP consumables: ~$3.6B, ~9%. Pads near-monopoly; slurry oligopoly. Margin high (~20–50%). Moat: qualification, no substitute. PE entry: low.
Mask blanks & pellicles: ~$0.2B (EUV), ~15%. Near-duopoly; single-source pellicle. Margin rich (30%+ EBIT). Moat: extreme. PE entry: none.
The read: moat depth and buyer-accessibility are almost inversely related. The deepest moats (mask blanks, photoresist, CMP) are the hardest to buy, and the most accessible segment, wet chemicals, is the weakest business. The prize is the exception: a segment that is both high-moat and enterable. On this map, only deposition precursors and advanced packaging are both.
Where the profit sits
Margin rises toward the high-purity, single-source positions and collapses in the commoditizing middle. The richest sit at 30%+ EBIT (mask blanks, precursors) and up to 50% (the ABF film in packaging); the commodity floor is wet chemicals at ~9%. Margin and moat travel together, so the accessible-but-thin segments get bought for cash flow, while the accessible-and-rich ones are worth a real multiple.
That’s the map, and the eight deep dives are below. The full guide takes each of the eight segments about sixteen pages deep: value chain, fragmentation and where to hunt, the premium mechanism, how the money is made, who competes, the moat, geopolitics and reshoring, the deals and capital, the one shift to watch, and a Red Team page on what would change the thesis.
Download the Teaser Here:

Or explore the map as an interactive one-pager (free): https://field-guide.augustgraceadvisory.com/electronic-chemicals-preview
