

Earlier this fall I followed one jet down its supply chain, from the primes to the coating shops. This time I wanted to try the same thing with a dollar.
The dollar comes from a chart that's been going around since late September. It's a Sankey chart, the kind where the width of each stream shows how much money flows through it. It's an illustrative allocation published by a16z Growth, citing BNP Paribas Equity Research estimates. You'll find it on slide 44 of a16z's State of Markets II.
It splits $100 of AI data-center capex into five buckets. The semiconductor bucket gets $50, including some server production. I’ll call it chips for short. Power gets $20. Networking gets $15. Cooling and facilities get $7.50 each.
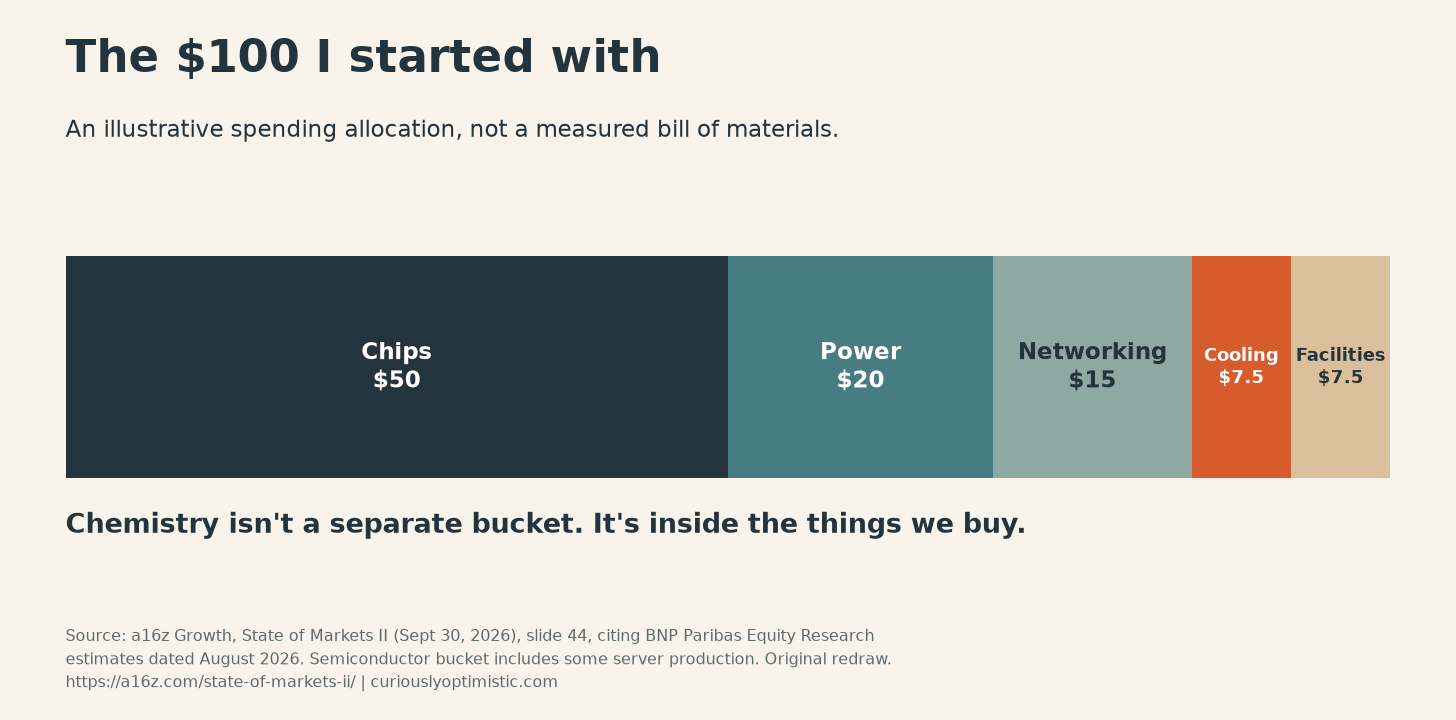
It's a good chart. It also has no chemistry on it. No photoresist, no specialty gas, no coolant. Chemistry is where I spend my time, so that's the part I went looking for. Is the chemistry tiny? Or is the chart just drawn at a level where you can't see it? So I ran the numbers.
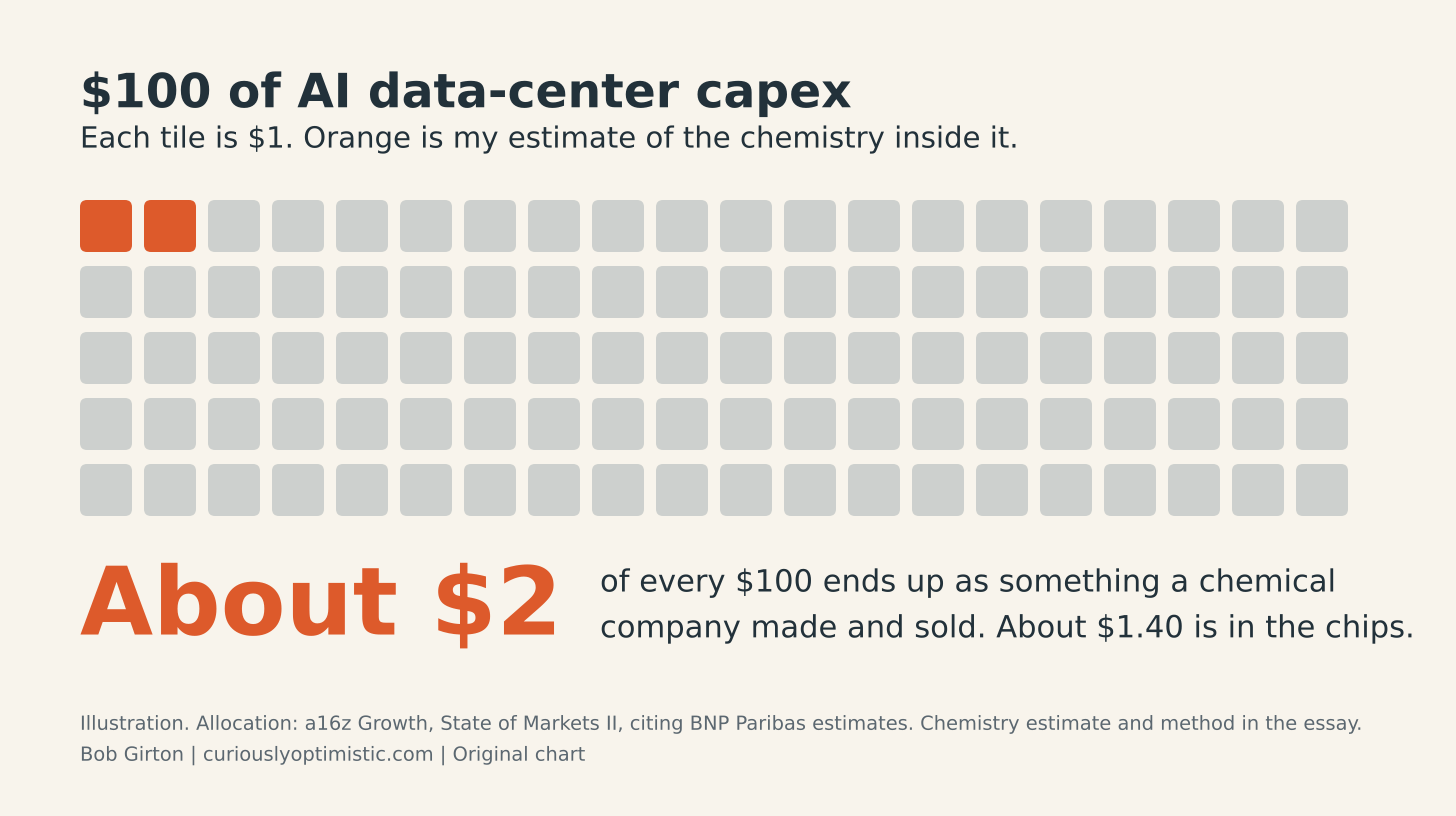
Here's the short version. By my math, about $2 of every $100 ends up as something a chemical company made and sold. About $1.40 of that is inside the chips. The rest is spread thin across power gear, cables, chillers and buildings. A broader cross-check using reported materials totals lands near $2.80. Those are my calculations, not a measured limit on AI spending. I'll show the steps.
Why the $100 matters right now
The late-October earnings calls made the question bigger. For calendar 2026, Microsoft guided to about $170 billion of capex. Alphabet reaffirmed $195 billion to $205 billion. Meta guided to $135 billion to $145 billion. Amazon said about $220 billion.
That’s roughly $720 billion to $740 billion from four companies in one year. The four don't define capex the same way, and none of these are AI-only budgets.¹ I haven't treated that sum as an AI market size.
So the $100 stands in for a very large pile of money. The question is what it physically turns into.
How I counted
I kept the definition narrow. Chemistry here means things you'd buy from a chemical maker. That's gases, acids, solvents, resins, coatings, adhesives and coolant fluids, plus the specialty materials a chip plant uses up. Copper, steel and silicon are materials, but I left them out of the main number. A copper busbar is metal. The plastic jacket around a cable is chemistry.
No single source covers all five buckets, so I used two.
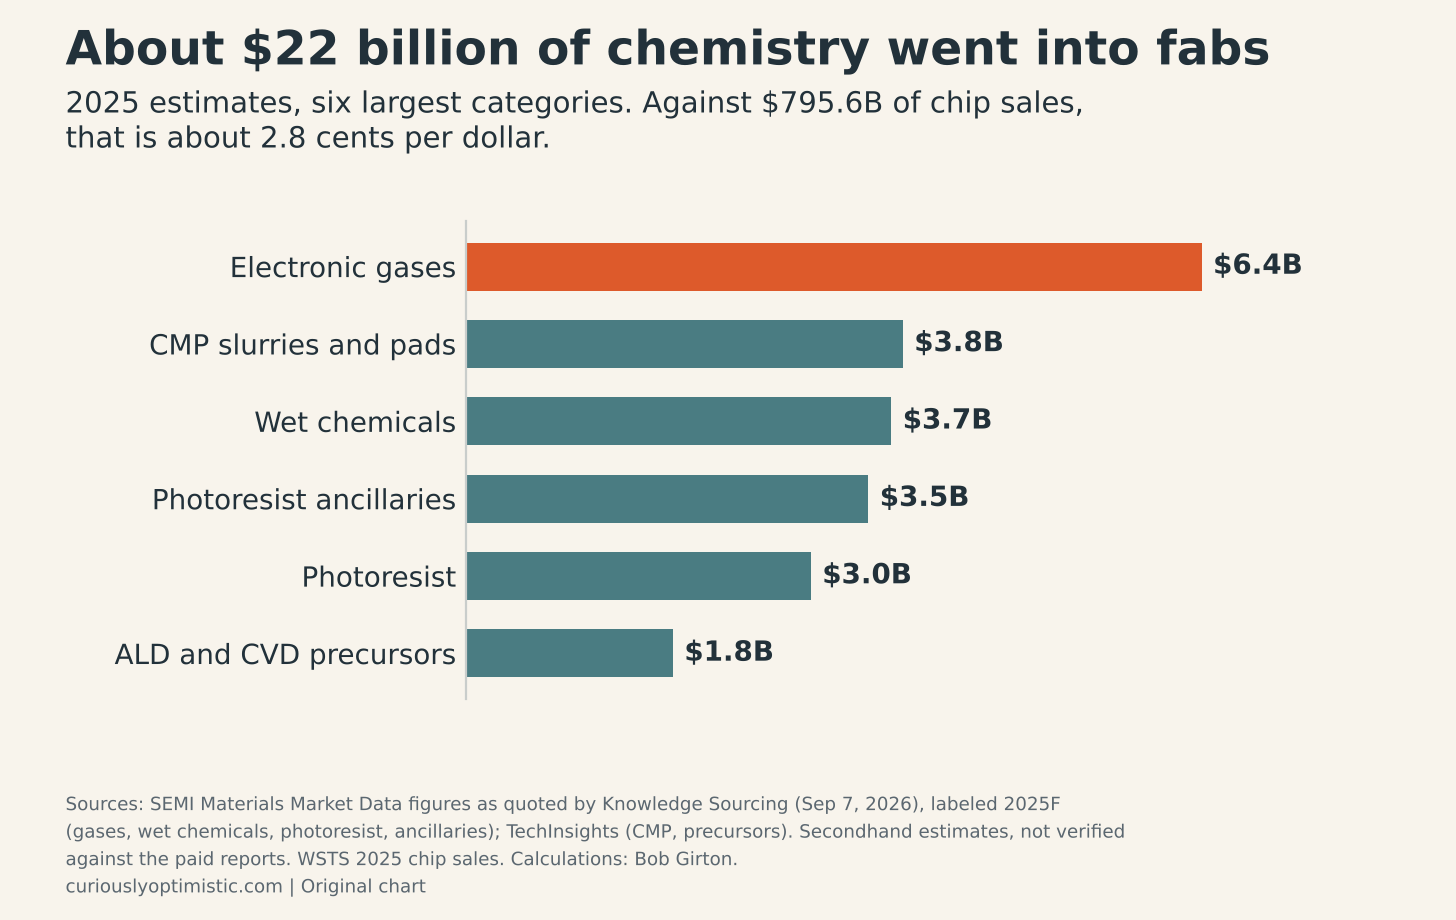
For chips, I started at the fab, the chip plant. Fabs buy chemistry every time a wafer moves through a step. Market researchers track those purchases by category, mostly behind paywalls. Add up their six big categories for 2025 and you get about $22.2 billion. Those are secondhand industry estimates, not audited numbers, so I check them against a verified total below.
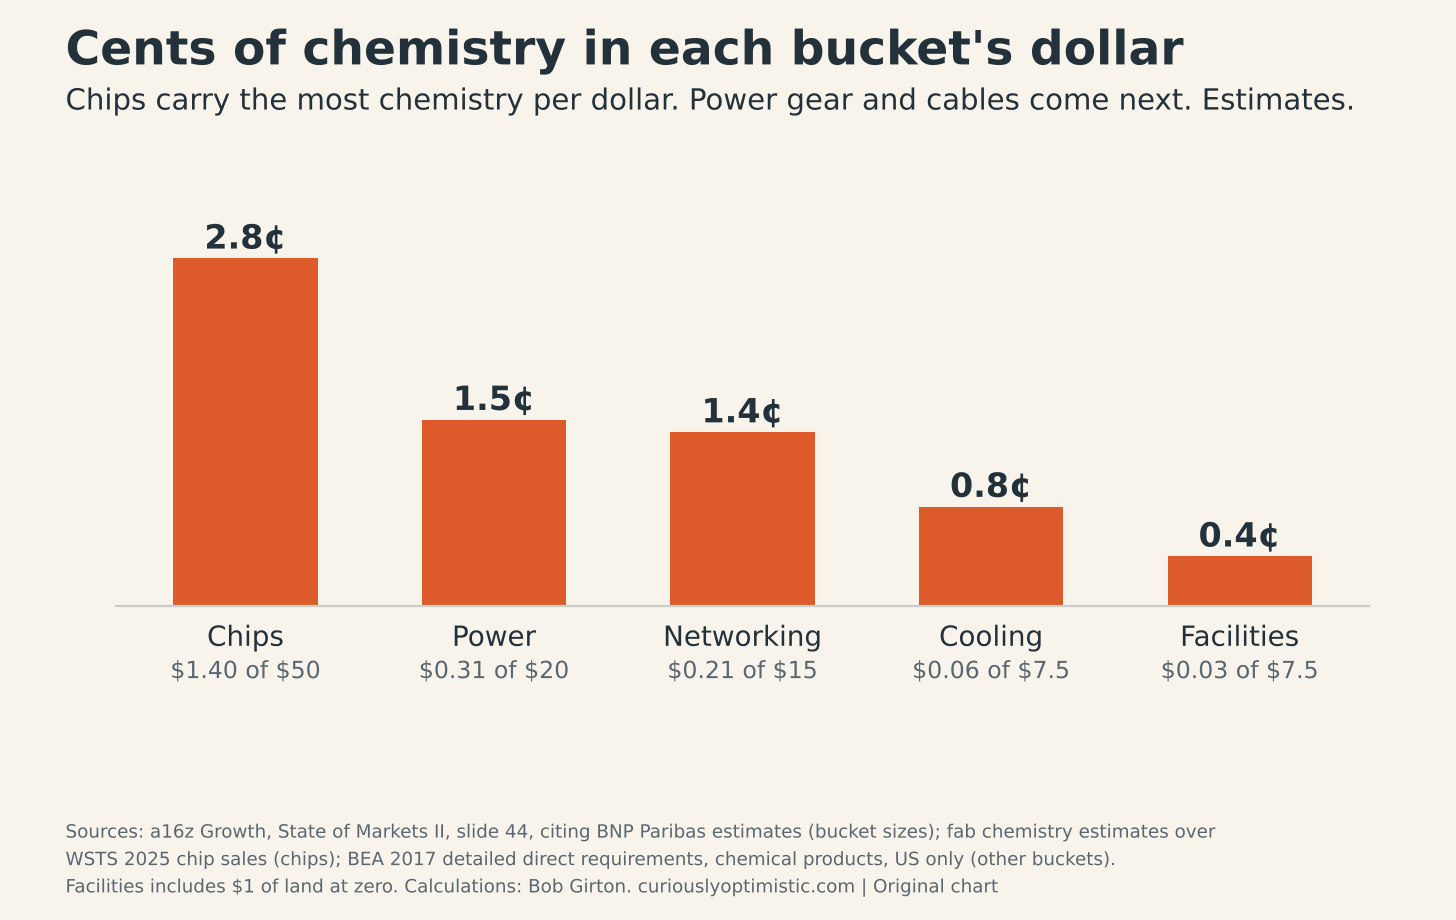
WSTS, the industry’s sales tracker, put 2025 global chip sales at $795.6 billion. Divide one by the other. That’s about 2.8 cents of fab chemistry per dollar of chips sold.
For everything else, I used the Bureau of Economic Analysis input-output tables. BEA is the government office that keeps the national accounts. Its input-output tables show, for each US industry, how many cents of every sales dollar it spends buying from other industries.
I matched each Sankey line to the closest industry. Then I read off how much it spends at chemical plants. I used the 2017 detailed table, and it's US only. Treat those numbers as rough. These are chemical makers' sales inside a supply chain, not extra spending to add on top of the $100.
The six fab chemistry categories
These are secondhand industry estimates for 2025, not verified category actuals.
Photoresist, the light-sensitive coating that takes the circuit pattern, about $3.0 billion
Photoresist ancillaries like developers and anti-reflective coatings, about $3.5 billion
Wet chemicals, the ultra-pure acids, solvents and peroxide used to clean and etch, about $3.7 billion
Electronic gases, about $6.4 billion
CMP slurries and pads, about $3.8 billion
ALD and CVD precursors, about $1.8 billion
The first four are SEMI Materials Market Data figures as quoted by Knowledge Sourcing. SEMI’s own free release doesn’t publish them, and the source labels them 2025F. The CMP and precursor figures are from TechInsights posts. TECHCET’s earlier forecast for CMP in 2025 was about $3.6 billion. Together that’s about $22.2 billion.
Chips: $50 in, about $1.40 of chemistry
This is where the chemistry actually lives. It helps to walk through what a wafer goes through.
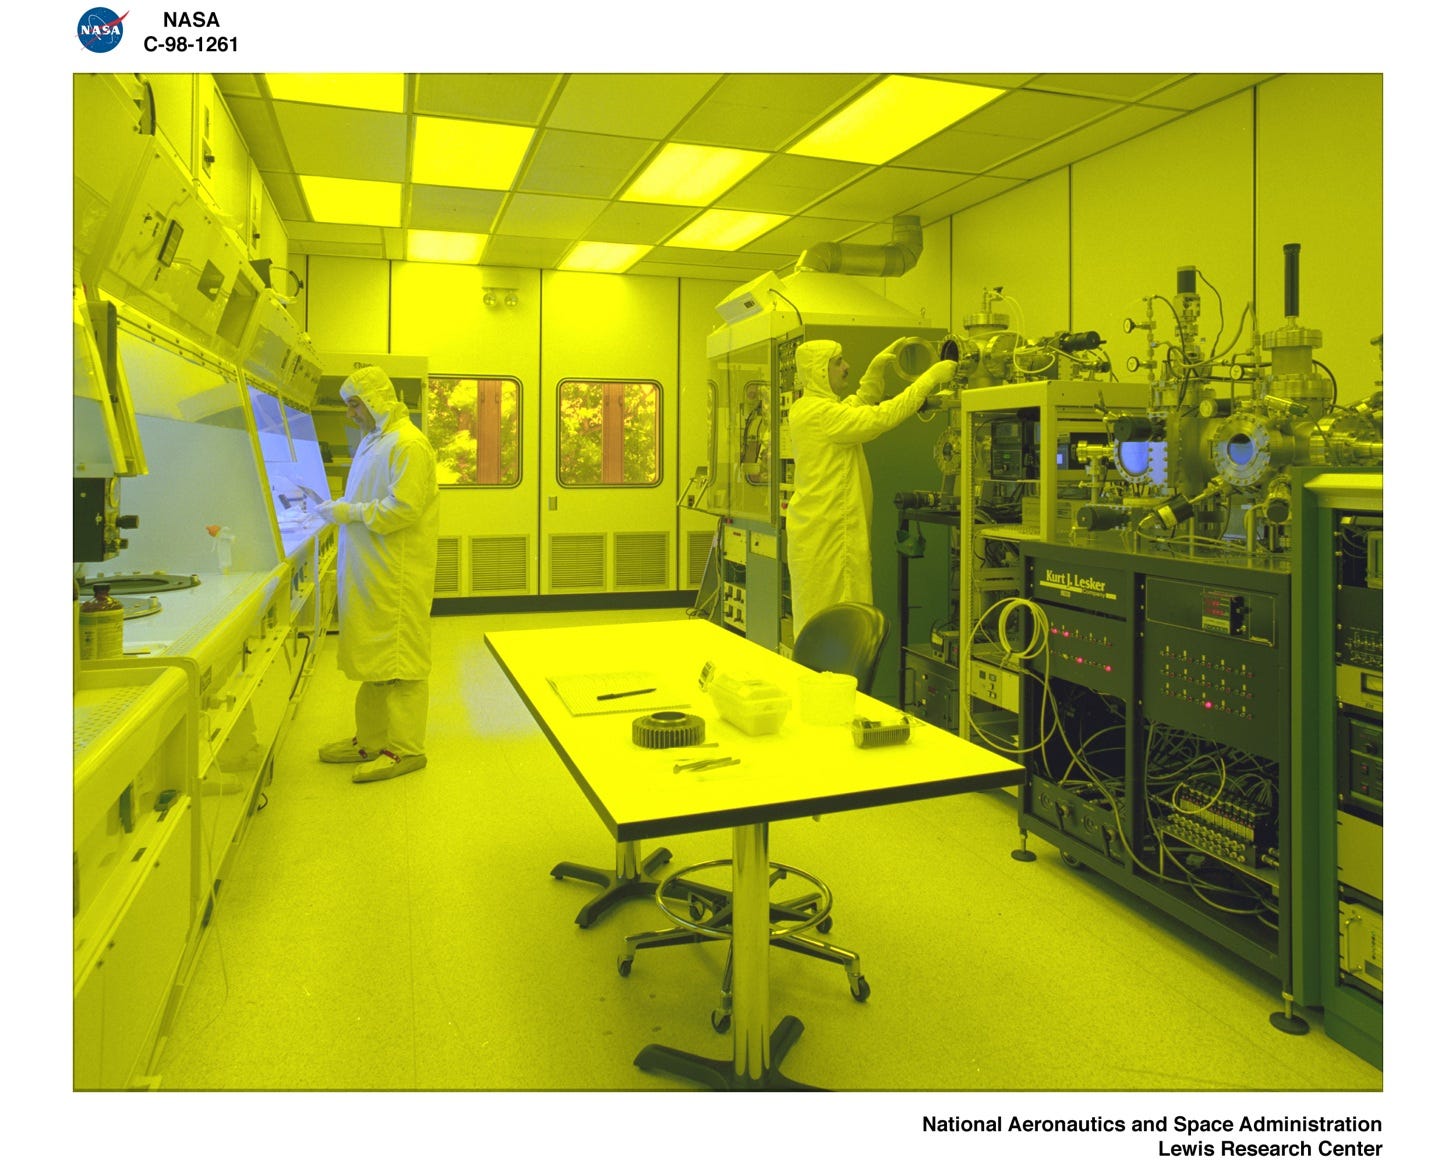
First it gets coated in photoresist, the light-sensitive material that takes the circuit pattern. Then it gets exposed and developed, etched with specialty gases, and cleaned with ultra-pure acids and hydrogen peroxide. Those are the categories in the industry breakdown.
Next it gets polished flat by CMP, short for chemical mechanical planarization. A slurry of fine abrasive in chemistry is rubbed across the wafer with a pad. Then new films get grown on it from precursors. Those are specialty molecules that carry the atoms for each new layer. ALD and CVD, atomic layer deposition and chemical vapor deposition, are the two main ways they're laid down. Air Liquide ships these to fabs in canisters, in small quantities.
Apply 2.8% to the $50 chip bucket and you get about $1.40. Accelerators account for about $0.70, memory $0.42, and CPUs and server build $0.28.
Since that rests on estimates, I checked it against numbers SEMI actually reported. Fab materials were $45.8 billion in 2025. That’s about 5.8% of chip sales, or about $2.88 of the $50. But that total includes silicon wafers, which are materials, not chemistry. SEMI puts 2025 wafer revenue at $11.4 billion. Take those out and you’re left with about $34.4 billion, or about $2.16 of the $50.
That $2.16 is deliberately broad. It still includes photomasks and metal sputtering targets that aren't chemistry, and the two SEMI reports may not define the silicon line identically. I'll keep $1.40 as my working estimate.
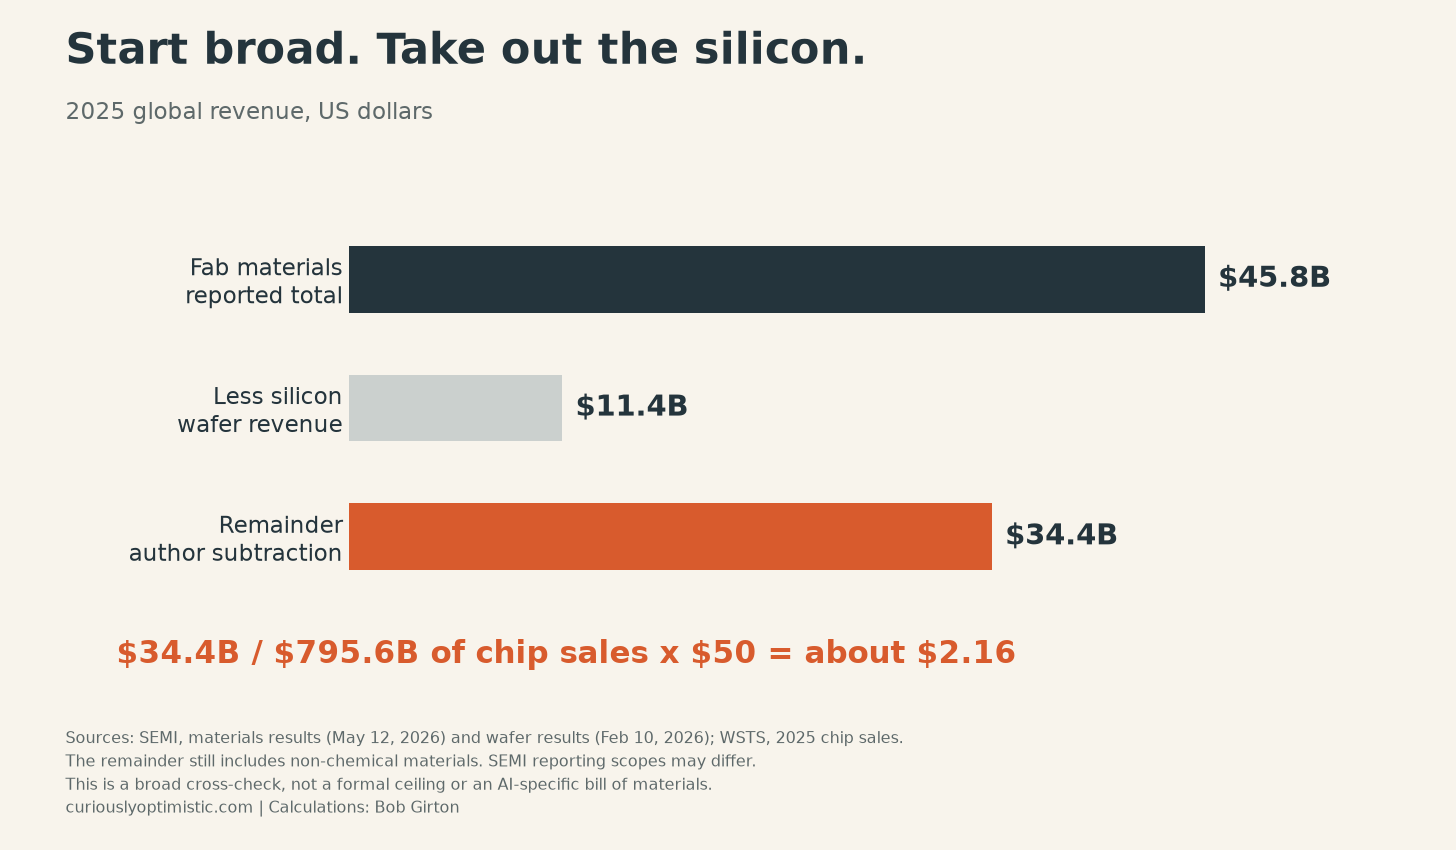
If I counted all semiconductor materials, including packaging, SEMI’s reported $73.2 billion would put about $4.60 inside the $50 bucket. But that’s a different question. It includes wafers, substrates and bonding wire.
Packaging is the part I find most fun. A chip's package substrate is a small layered board that wires it to the outside world. One insulating film used between those layers is ABF, Ajinomoto Build-up Film. And Ajinomoto, the seasoning company, puts its share of that film at about 95% (Ajinomoto).
Power: $20 in, about $0.31 of chemistry
Power is mostly metal and machinery. A large transformer is copper windings around a core of grain-oriented electrical steel. It sits in a tank of insulating oil.
The supply bottleneck isn’t necessarily chemistry. On October 30, Wood Mackenzie’s Simon Flowers wrote that waitlists for transformers are coming in at 162 weeks. He put circuit breakers at 137 weeks and heavy gas turbines at 278 weeks.
I wrote about the electrical side of this in July, in The last inch of copper.
A US transformer maker spends about 1.3 cents of each sales dollar at chemical plants. Most of that is paint and coatings. The oil mostly comes from refineries, which BEA counts as a separate industry.
A turbine maker spends about half a cent. Wire and cable makers spend about 4.9 cents, most of it on plastic resins for insulation and jackets. I mapped grid and generation to turbines, distribution to transformers, and on-site routing to wire and cable. That gives about $0.31.
Networking: $15 in, about $0.21 of chemistry
I used the chip rate for network processors and the wire-and-cable rate for cabling. Optics and switches get the assembled-electronics rate. Together that’s about $0.21. Most of it is in the processors and cable jackets.
Cooling: $7.50 in, about $0.06 of chemistry
This is the one I had wrong in my head before I ran it. I expected cooling to be a chemistry story, and in some ways it is.
Direct liquid cooling pipes coolant to a plate on the chip instead of blowing air across it. It’s a different place to look for chemistry than the chiller itself.
But the Sankey’s cooling lines are chillers, cooling towers, coolant distribution units and cold plates. That’s machinery and copper. The BEA rate for air conditioning and refrigeration equipment makers is under a cent per dollar.
An initial fluid fill can be part of an installation. But the recurring refrigerant top-ups and water treatment belong in operating costs. My equipment-maker proxy doesn't measure those purchases separately. Cooling chemistry is real. This capex model doesn't measure its full demand.
Facilities: $7.50 in, about $0.03 of chemistry
This bucket is concrete, steel, roofing, sealants, paint and fire suppression. Builders buy most of that as finished products. So their direct chemical purchases run about half a cent per dollar, mostly paint and coatings. I assigned land zero direct chemistry. That's about $0.03.
Adding it up
Put the five buckets together and it comes to about $2.01 of chemistry for every $100: $1.40 in chips, $0.31 in power, $0.21 in networking, $0.06 in cooling and $0.03 in facilities. Call it about $2.
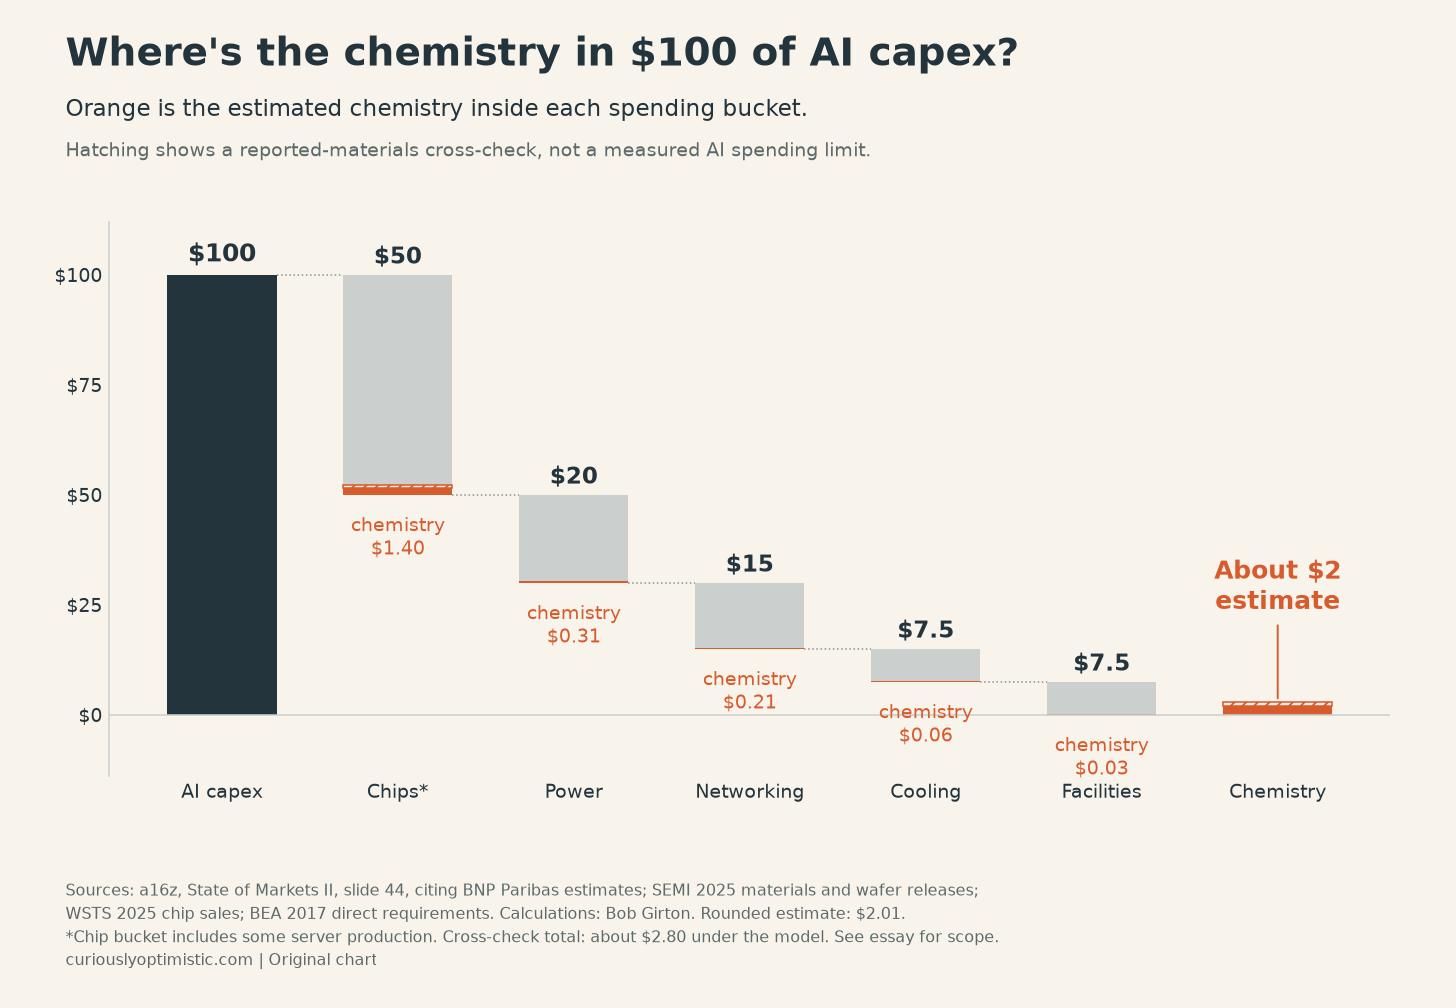
Swap in the $2.16 materials allowance for the $1.40 chip estimate and the total moves to about $2.80. That's a check on the size of the answer, not a bill of materials.
I haven’t turned that two cents into a forecast for chemical sales. The spending definitions, timing and industry averages don’t line up well enough for that.
Why the small number is the interesting part
Two things stood out to me.
First, chemistry is a consumable, and capex charts measure installs. The chip-chemistry estimate is mostly materials a fab consumes while it makes wafers. Those purchases recur when it makes more chips. Data-center coolant top-ups and water treatment recur for a different reason, keeping the installed equipment running.
A capex chart shows the scanner and the chiller. It doesn't show what runs through them every day.
Second, small isn’t the same as unimportant. In the Electronic Chemicals Field Guide I wrote that these chemicals are a small slice of what a chip costs. A contamination problem can damage a wafer. That doesn’t mean every impurity scraps every chip. It means the purchase price of a chemical isn’t a good measure of what depends on it.
I'd want to understand qualification and contamination risk before I judged one of these materials by its market size.
Where I might be wrong
The chip rate is an industry average. AI accelerators carry very high margins. NVIDIA’s GAAP gross margin was 71.1% in fiscal 2026 (NVIDIA), so less of an accelerator’s price is manufacturing. My $0.70 for accelerators is probably high. Memory might run the other way.
The six chemistry categories are secondhand industry estimates. Some are forecasts, the CMP figure has an earlier lower forecast, and the scopes differ. That's why I show the reported-total cross-check next to the estimate.
The BEA rates are US, 2017 and first tier only. Matching a Sankey line to one industry is a judgment call.
The Sankey is itself an illustrative allocation, not a measured bill of materials. Its fab equipment branch doesn’t add up to its parent node, which looks like a typo on the slide.
I’m counting purchases, not how much a process depends on a material. Those aren’t the same thing.
If you’ve got a cleaner bridge from accelerator dollars to fab chemistry, reply and tell me. And if you want the next one, subscribe to Curiously Optimistic.
¹ Microsoft’s figure is calendar 2026 and includes finance leases. Amazon's is cash capex. Meta's includes finance-lease principal payments. These are company-level guidance measures, not AI-only budgets.
Sources: a16z, State of Markets II (September 30, 2026), slide 44, an illustrative allocation published by a16z Growth, citing BNP Paribas Equity Research estimates dated August 2026. Company investor relations releases and call materials for capex guidance (October 2026). SEMI Materials Market Data Subscription release (May 12, 2026). SEMI Silicon Manufacturers Group 2025 wafer results (February 10, 2026). SEMI category figures via Knowledge Sourcing (September 7, 2026). TechInsights CMP and precursor posts (February and March 2026) and TECHCET’s CMP forecast (September 2025), all secondhand estimates. WSTS 2025 results (March 2026). Wood Mackenzie, “Speed to power” (October 30, 2026). BEA 2017 detailed commodity-by-industry direct requirements, chemical products, matched to the nearest equipment and construction industries. Category estimates remain unverified against the underlying paid reports. Estimates are mine and labeled. Company names are evidence, not recommendations. Nothing here is investment advice.